


When one useful data shortcut quietly became the rule
An AI Reality case study - Data Quality and Analytics
Case ARC-01-02 | Fictional composite | Free reader edition, 2 October 2026
This is a fictional composite case for the Data Quality and Analytics domain. The people, organisation, numbers, and artefacts are invented. The domain promise is simple: AI makes bad data more persuasive, faster, and harder to challenge.
The case
The shortcut had an origin story, and Ari Pembroke was the only person who still remembered it. Fourteen months earlier, with a board pack due and a source column full of junk, someone had pasted the column into an AI assistant, asked it to tidy the values, and pasted the result back. It worked. The pack went out. Nobody wrote down what the tool had changed.
That cleaned export was still the standing input to the operations dashboard. Not because anyone decided it should be, but because the next month someone reused the file, and the month after that the reuse was simply how the numbers were produced. Drafting and preparation time was down 26% - in this case's invented figures, from about 19 hours to 14 hours for each monthly pack. The queue of unresolved exceptions had climbed from 13 to 17 items in the sampled period, and each of those items was a small argument about whether the dashboard was right.
Ari's job was evidence, and the evidence had a hole in it. When a figure looked odd, the only way to check it was to re-run a cleaning step that existed in no document, with settings nobody had recorded, against a source column that had since been edited by hand. Reopening a number was technically possible and socially expensive, so mostly nobody reopened anything.
The people around the dashboard wanted different things. The analysts wanted the shortcut named so they could stop defending it. The operations manager wanted the exceptions queue to shrink, not to be explained. Ari wanted the organisation to be able to answer one question without embarrassment: where does this number come from?
Critical evaluation
Ari's review had one rule: the dashboard's confidence counted as a claim, not as evidence. Four questions carried it.
| Question | Working answer | What remains open |
|---|---|---|
| What happened? | A one-off AI cleanup became the undocumented standing input to a trusted dashboard. | How many figures on the dashboard pass through it |
| What does the result support? | Preparation is 26% faster. The exception queue grew from 13 to 17. | Whether the speed or the doubt is the truer signal |
| What could explain it another way? | Source decay, hand edits, or the cleaning step changing values silently. | Which one the exception items actually show |
| What test comes next? | Reproduce one month end to end from the raw source, with a named reviewer and a stop condition. | Whether anyone is given the week that takes |
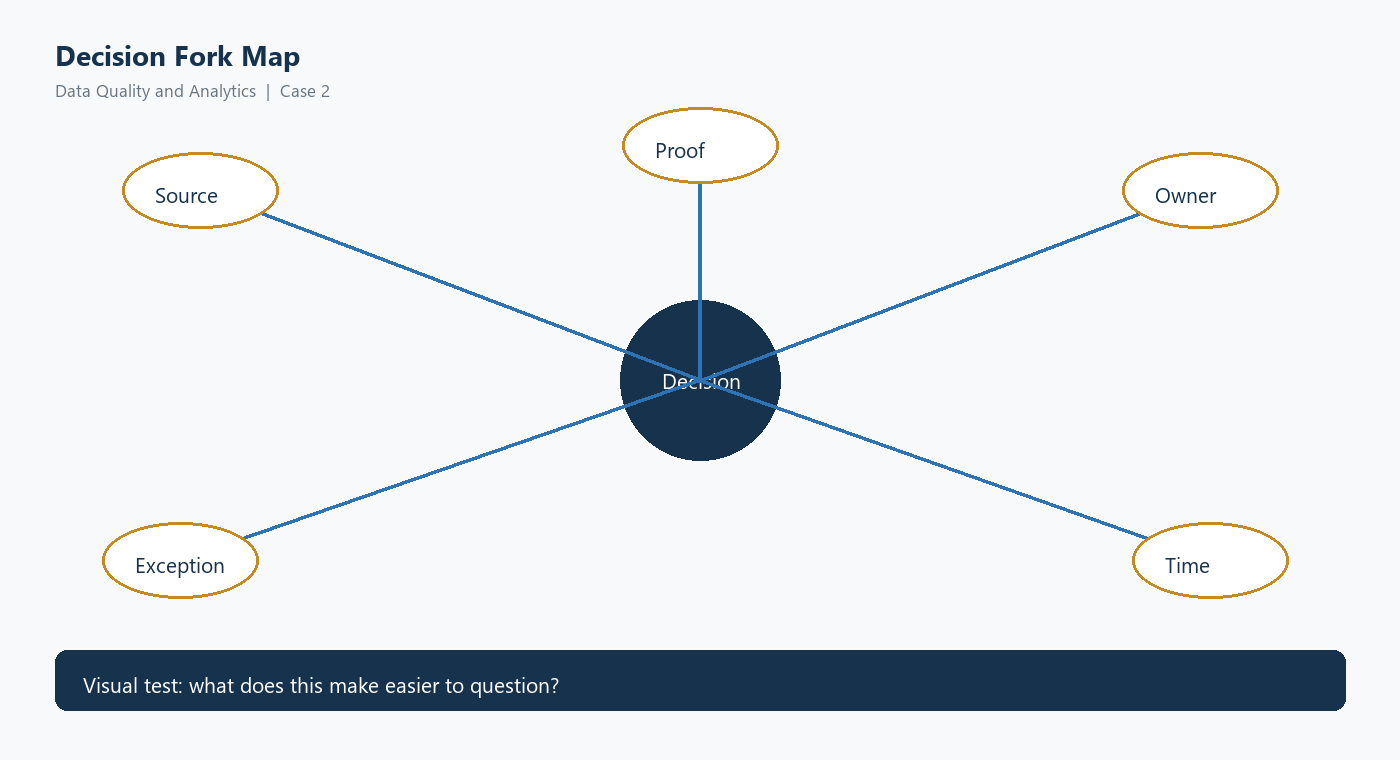
Open the diagram at full size
The decision room
Ari had to decide whether to leave the dashboard alone, take it offline until the pipeline was documented, or keep it running while rebuilding the path behind it. The case was not about whether the shortcut was clever. It was about whether a rule nobody agreed to could keep making the company's numbers.
| Choice | Immediate gain | Immediate cost | Second-order risk |
|---|---|---|---|
| A. Keep the current path | The dashboard never goes dark | Every number carries an undocumented step | The shortcut hardens into the operating model, unauditable |
| B. Take the dashboard offline | The doubt is honest and visible | The company loses its shared picture mid-quarter | Decisions continue on private spreadsheets instead |
| C. Keep it running and rebuild the path behind it | Continuity now, a documented pipeline soon | One month of double work | The dashboard learns to carry its own provenance |
What changed after thirty and ninety days
At thirty days, the rebuilt pipeline had reproduced eleven of the thirteen watched figures and explained the other two, one of which had been wrong for five months. At ninety days, the cleaning step existed as a documented, reviewed stage with a name, an owner and a changelog, and the exception queue had started falling for the first time in a year, to 11 open items (an invented figure).
Nothing about the story is dramatic, which is what makes it dangerous. The dashboard was never attacked and never broke. It simply drifted from the truth one undocumented convenience at a time, and the organisation's confidence in it did not drift at all.
The case in numbers
Read the speed gain and the exception count together. Preparation got faster while doubt about the dashboard grew, and only the rebuild produced a figure anyone could trace. Every case figure here is fictional. The last column shows which numbers the case states, which are arithmetic on those, and which are invented teaching assumptions you can replace with your own.
| Measure | Before | After | Basis |
|---|---|---|---|
| Monthly pack preparation | 19 hours | 14 hours (down 26%) | 26% stated in the case; hours invented |
| Time saved | - | About 5 hours a month | Derived from the two rows above |
| Open exception items | 13 | 17 (up 31%) | Counts stated; percentage derived |
| Watched figures traced to the raw source (day 30) | Not possible | 11 of 13 (85%) | Stated; percentage derived |
| Longest-running wrong figure | Unknown | 5 months | Stated |
| Open exception items (day 90) | 17 | 11 (down 35%) | Invented; the case says only that the queue was falling |
| Cost of the rebuild | - | About 24 analyst-hours (3 days), once | Invented |
| Payback on preparation time alone | - | About 5 months | Derived from the invented rebuild cost; ignores the value of trusted numbers |
The payback looks good and still misses the point. Five hours a month bought a dashboard nobody could audit. What the rebuild bought was the ability to say where a number came from.
Source: AI Reality Check 28x28 V3.2 (12 July 2026), Data Quality and Analytics volume, case ARC-01-02, source title "The Data Quality Shortcut That Worked Once and Became the Rule". Rewritten for the reader edition. Facilitator guide available separately with registration. Almost Magic Tech Lab.
Running a session with this case? Request the facilitator guide.